Skip to content
CRM

CRM Reporting & Forecast

CRM

CRM Reporting & Forecast

Analyse your sales pipeline, track win rates, build revenue forecasts, and identify bottlenecks with CRM's built-in reports.

6 steps Updated Mar 7, 2026 SOP · Standard

CRM reporting turns pipeline data into actionable intelligence. This guide covers the key reports every sales manager needs: pipeline analysis, win/loss tracking, activity performance, and revenue forecasting.

1

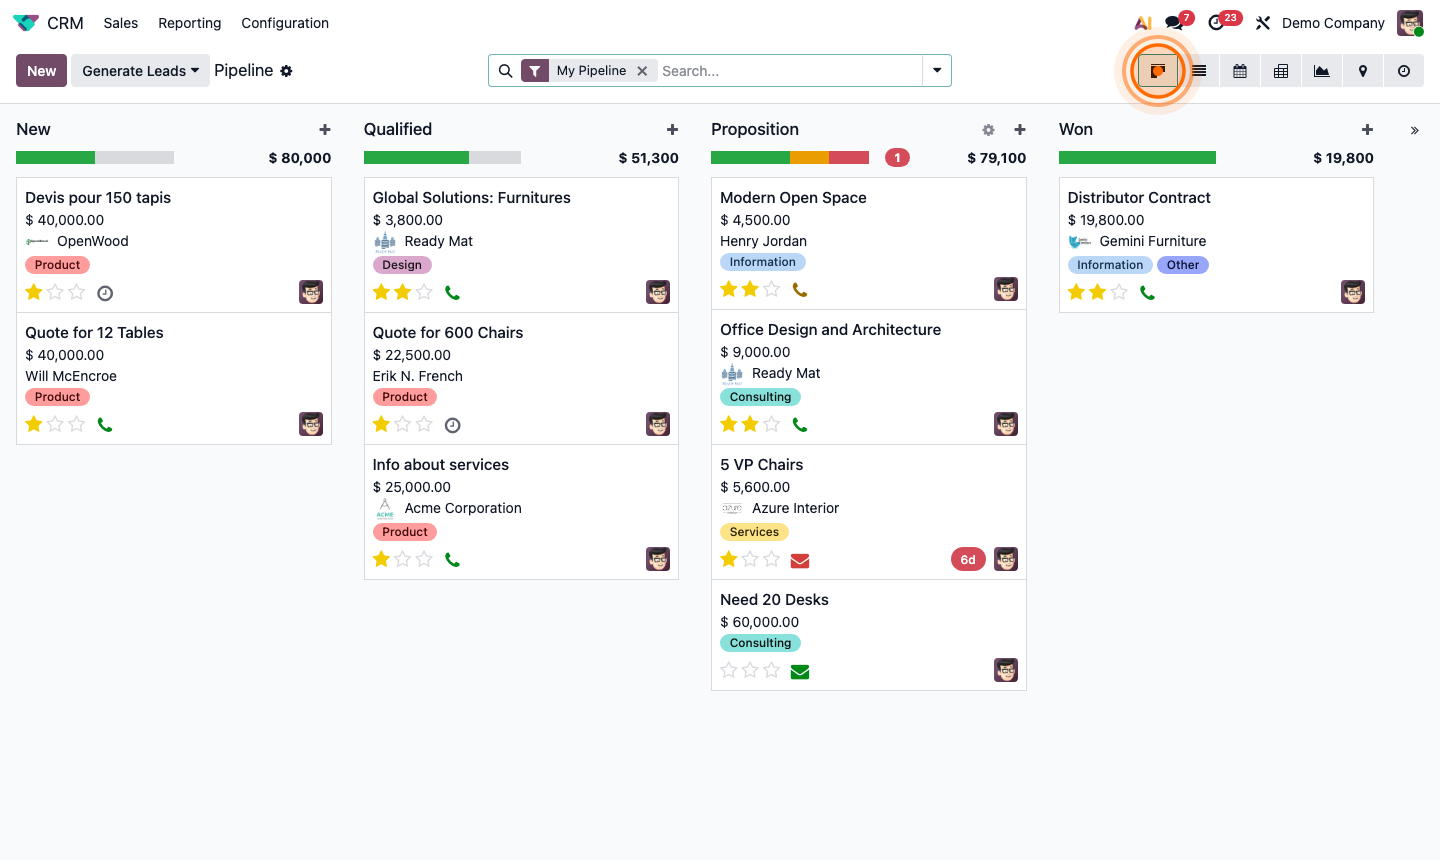
Access CRM Reporting

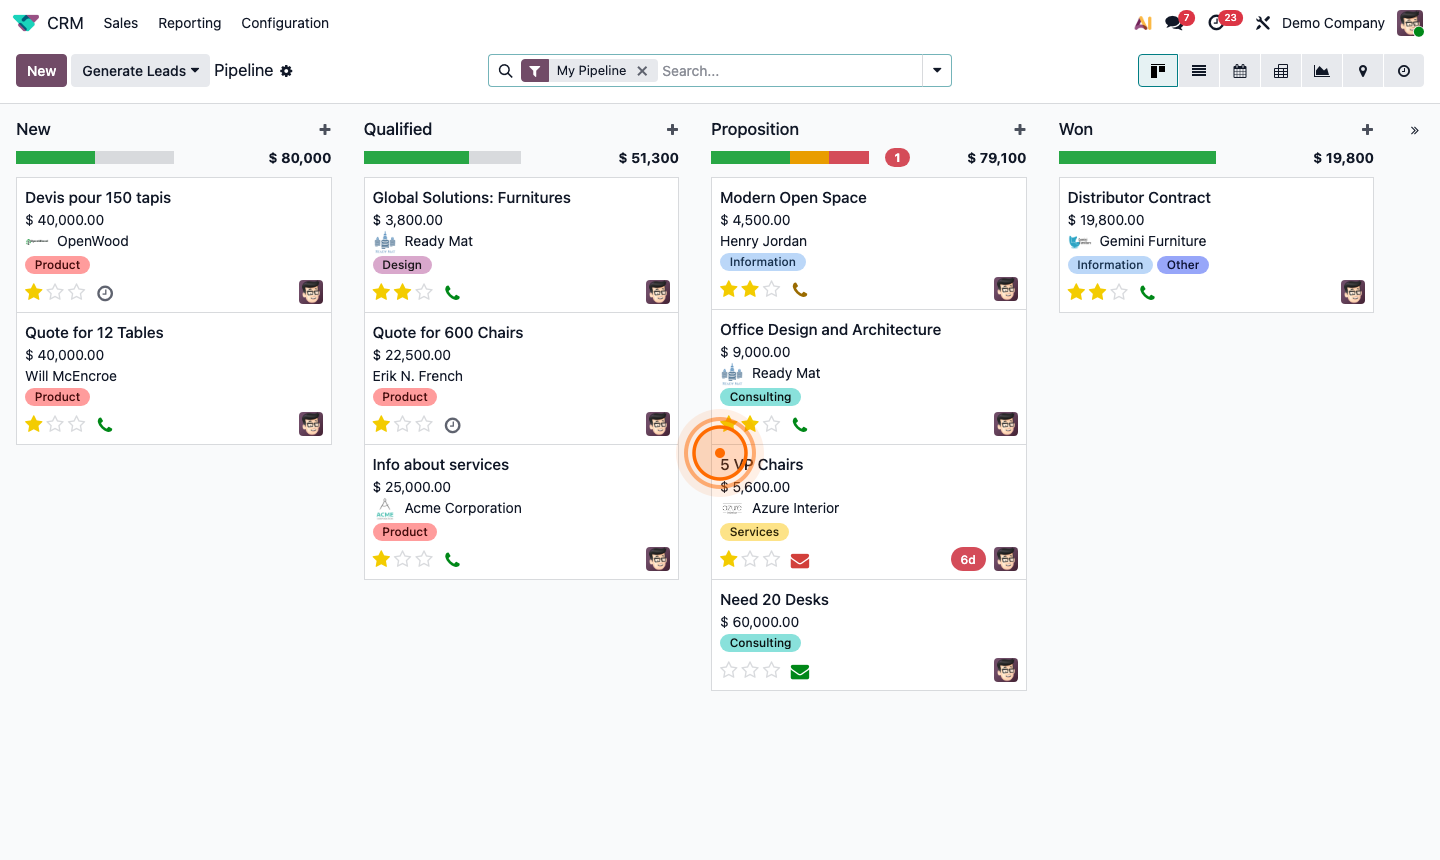
Go to CRM → Reporting. The menu has several report options:

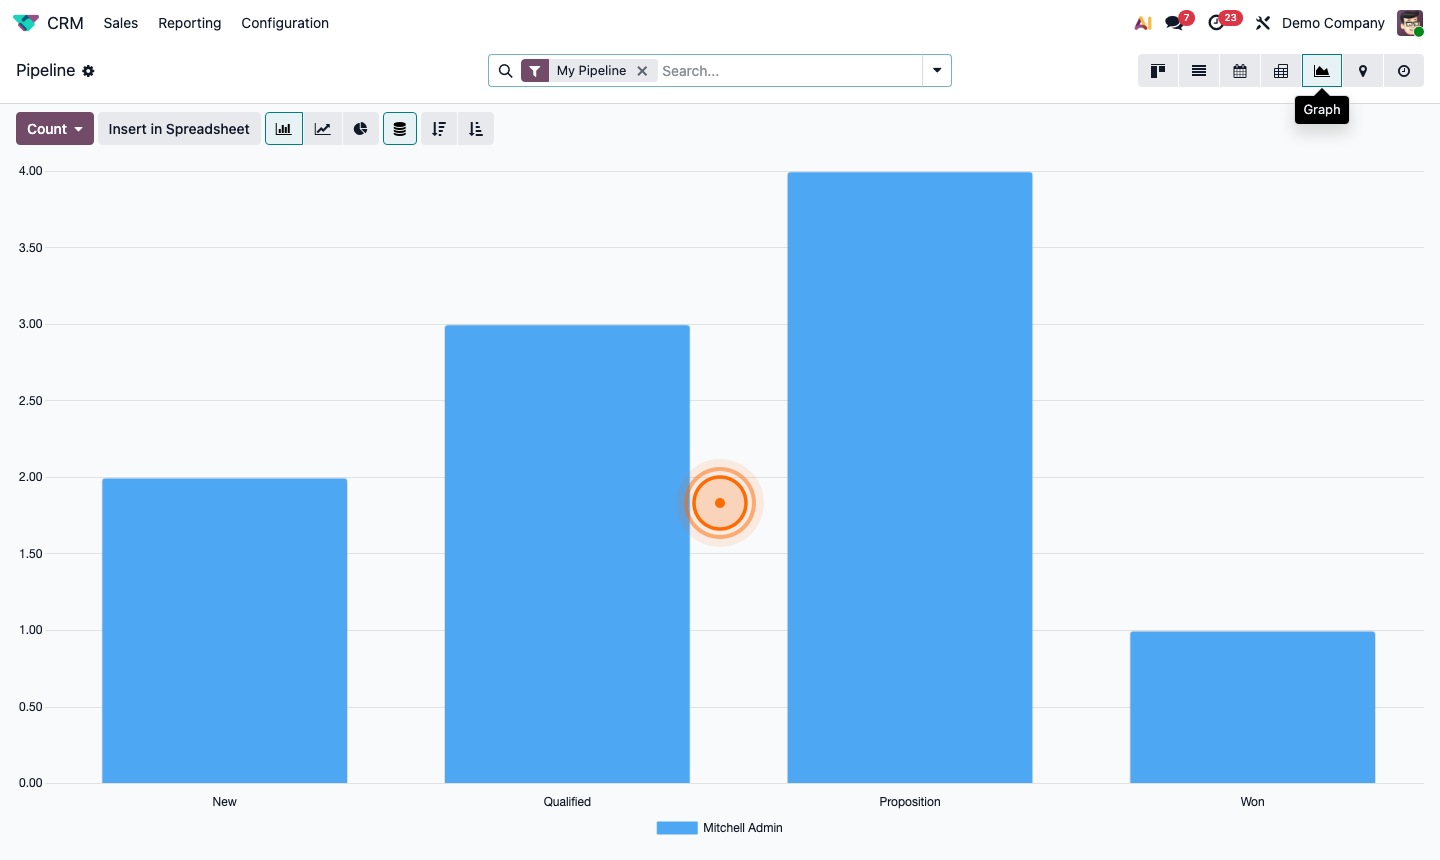
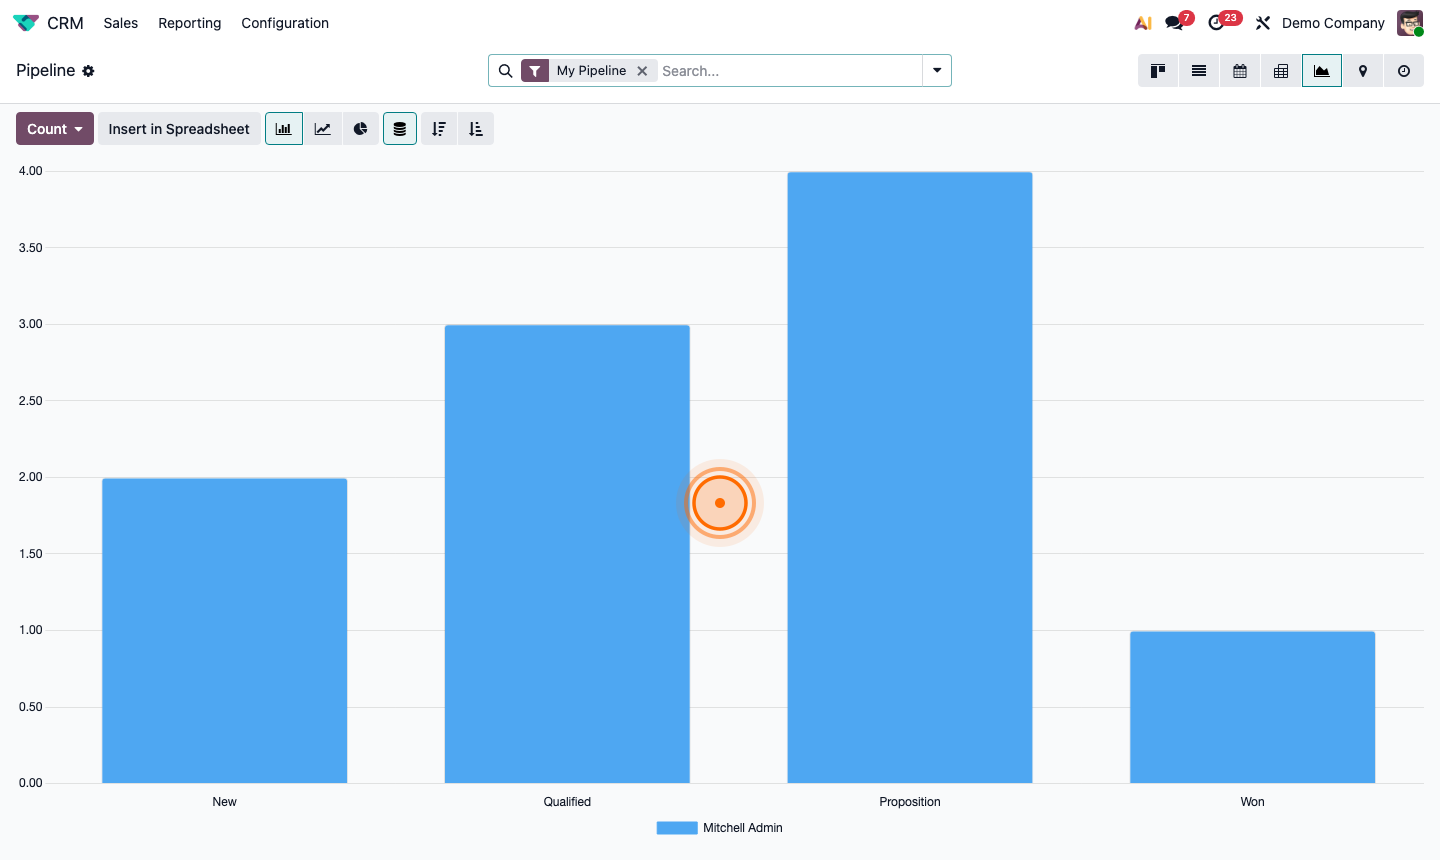
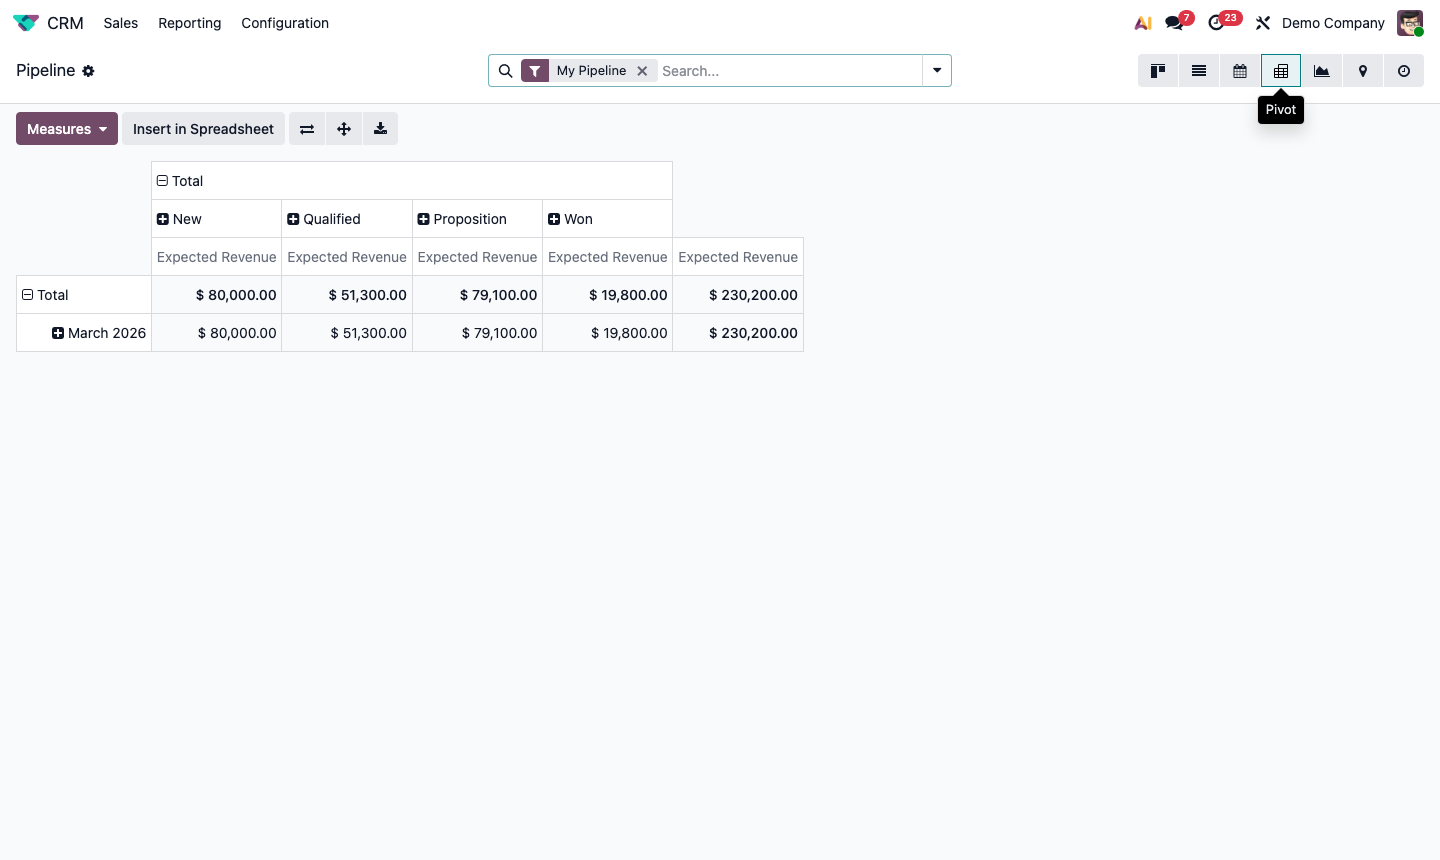
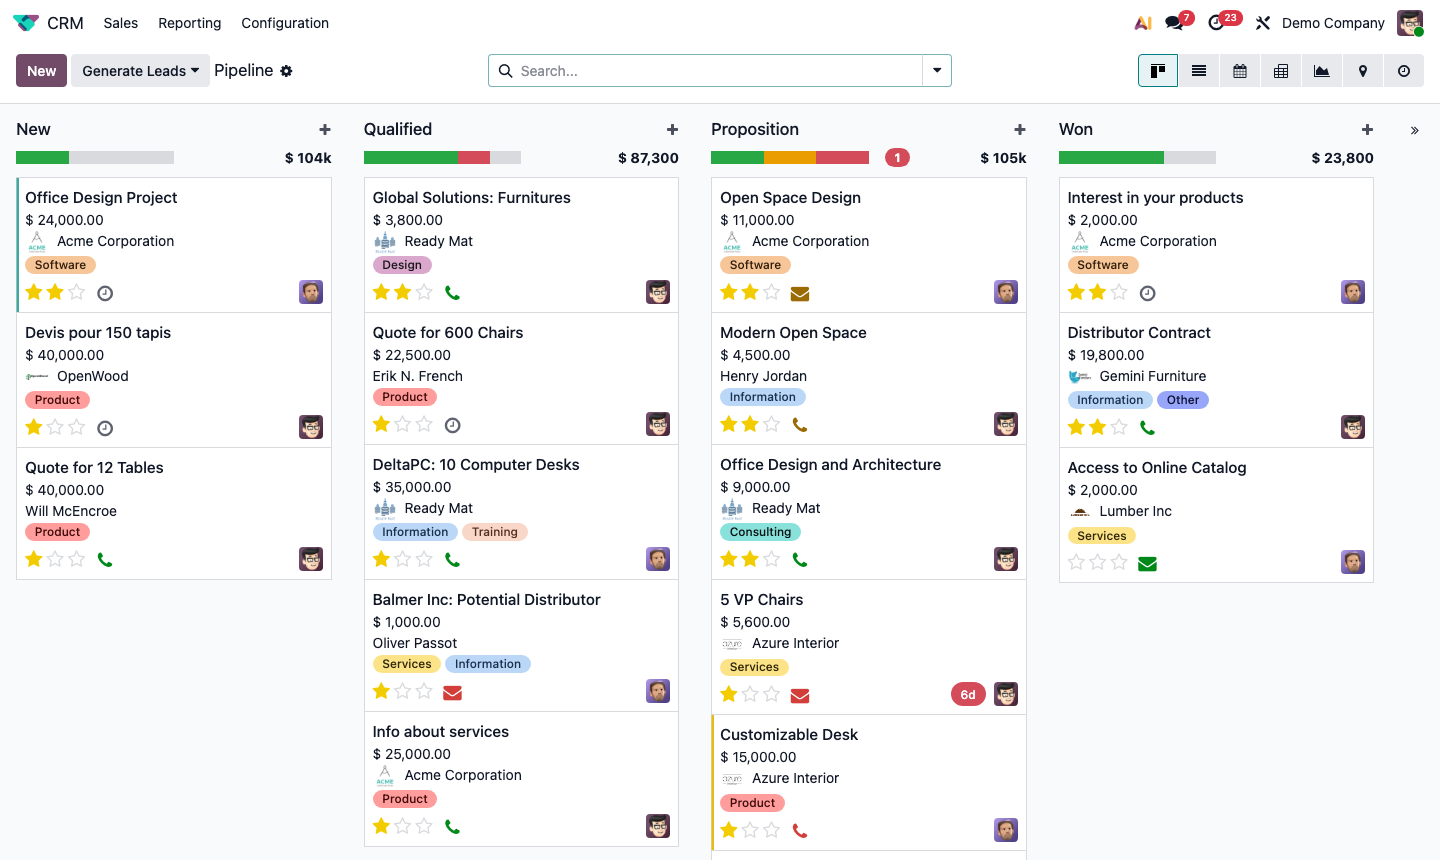
  • Pipeline Analysis — historical view of opportunities by stage, revenue, and probability
  • Sales Analysis — revenue metrics broken down by salesperson, team, or product
  • Forecast — projected revenue based on expected close dates and probability
  • Activities — activity completion rates by user

All reports support the same set of filters, group-by options, and visualisation modes (bar chart, line chart, pivot table).

Step 1: CRM Reporting menu showing Pipeline Analysis, Forecast, and Activities options

2

Read the Pipeline Analysis Report

Go to CRM → Reporting → Pipeline Analysis.

The default view shows a bar chart of opportunities grouped by stage. Key things to analyse:

  • Revenue by stage — where is revenue piling up? A big stack in “Proposal Sent” with slow progression suggests a follow-up problem.
  • Count by stage — are enough new leads entering the top of the funnel?
  • Average deal size — click Group By → Stage → Measure → Expected Revenue

Switch to Pivot table for a detailed breakdown. Add rows (e.g., Salesperson) and columns (e.g., Stage) to compare performance.

Step 2: Pipeline analysis bar chart showing opportunity count and revenue by stage

3

Track Win Rate and Lost Reasons

Filter the Pipeline Analysis to closed deals:

  1. Add filter: Won (checkbox) OR Active = False (to include lost)
  2. Group by: Stage and Won/Lost

For lost reasons specifically:

  • Go to CRM → Reporting → Pipeline Analysis
  • Filter: Active = False (lost opportunities)
  • Group By: Lost Reason

This shows which reasons are most common. If “Price too high” dominates, it’s a pricing/positioning problem. If “Went with competitor” is high, it’s a competitive analysis opportunity.

Step 3: Pipeline analysis filtered to closed deals grouped by won/lost and reason

4

Build a Revenue Forecast

Go to CRM → Reporting → Forecast.

The Forecast view shows expected revenue for the current and upcoming periods, weighted by probability:

  • Expected Revenue × Probability = Prorated Revenue

Use the date filter to switch between monthly and quarterly views.

The Forecast Kanban view (switch from Graph) shows each opportunity on a timeline, letting you drag deals to adjust their expected close date and instantly see the impact on the forecast.

Update probabilities regularly as deals progress — a stale 50% probability on a deal you’re about to close is misleading to the forecast.

Step 4: CRM forecast view showing prorated revenue by month with pipeline breakdown

5

Measure Sales Team Performance

Go to CRM → Reporting → Sales Analysis. Group by Salesperson.

Compare metrics per rep:

  • Number of opportunities created — is the pipeline being fed?
  • Won opportunities — absolute wins
  • Win rate — efficiency metric
  • Average deal value — quality of opportunities
  • Average days to close — speed of the sales cycle

Filter by date range to compare this quarter vs. last quarter. Export to Excel for deeper analysis or presentation to management.

Step 5: Sales analysis pivot table comparing salesperson performance across key metrics

6

Set Up CRM Dashboards

For ongoing monitoring, add key CRM metrics to your personal dashboard.

From any report:

  1. Configure the chart/pivot how you want it.
  2. Click the Insert in Spreadsheet button (table icon) to save it as a shared spreadsheet.
  3. Or use Dashboards app → Add a tile → select CRM report.

The standard Odoo Dashboards app lets you create a custom view with multiple report widgets from different modules — combine CRM pipeline, Sales revenue, and Invoicing totals on one screen.

Step 6: Odoo dashboard with CRM pipeline chart, win rate tile, and forecast widgets