Skip to content
Sales

Sales Reporting & Analytics

Sales

Sales Reporting & Analytics

Analyse revenue by product, salesperson, and period using Sales Analysis, dashboards, and custom pivot tables.

6 steps Updated Mar 7, 2026 SOP · Standard

Sales reporting in Odoo goes far beyond a simple revenue total. This guide covers the Sales Analysis report, how to build custom pivot tables and charts, and how to set up dashboards that give your team live visibility into performance against targets.

1

Open Sales Analysis

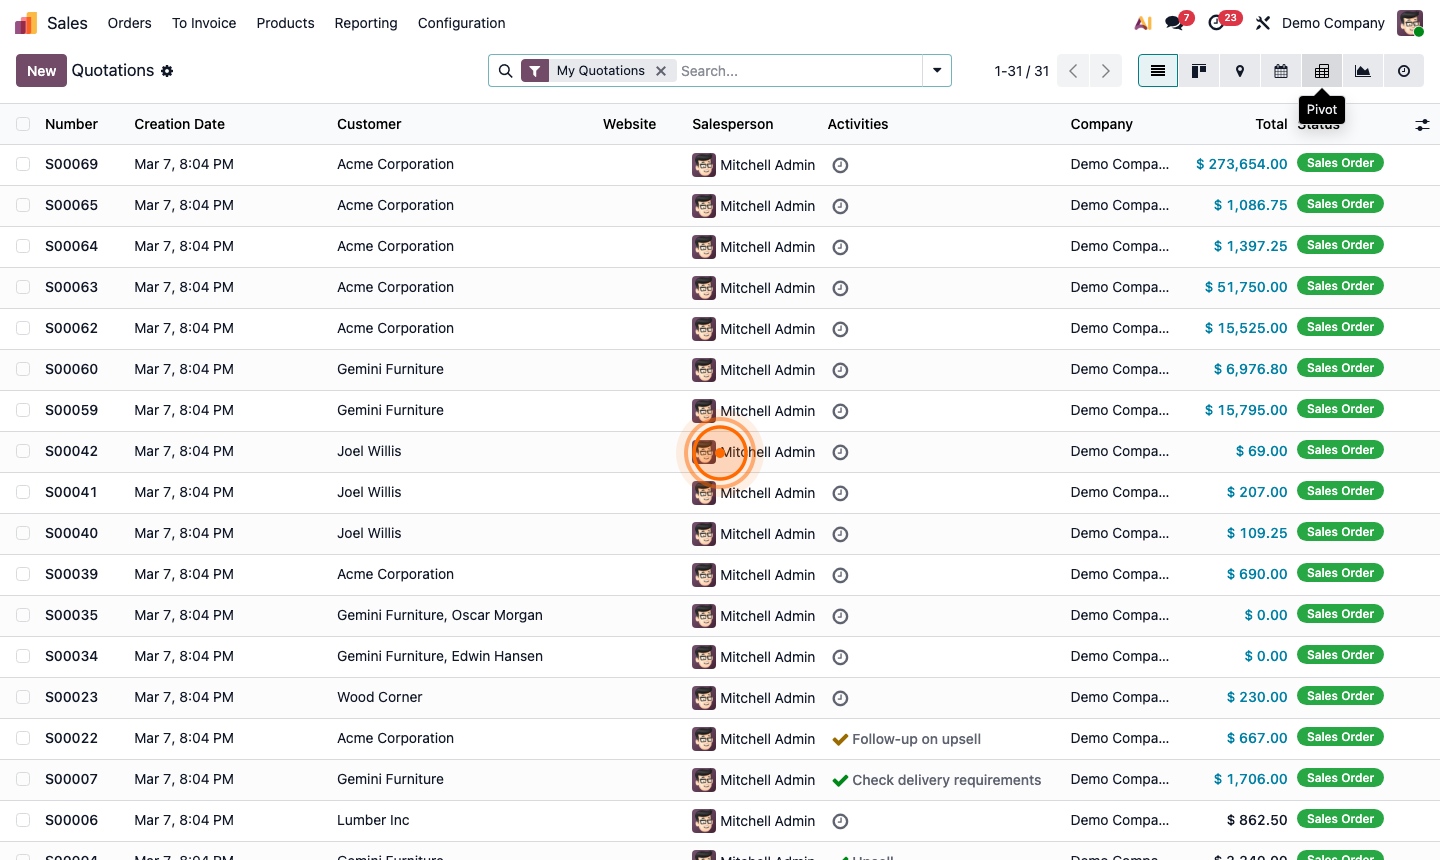
Go to Sales → Reporting → Sales Analysis (or Sales → Reporting → Orders).

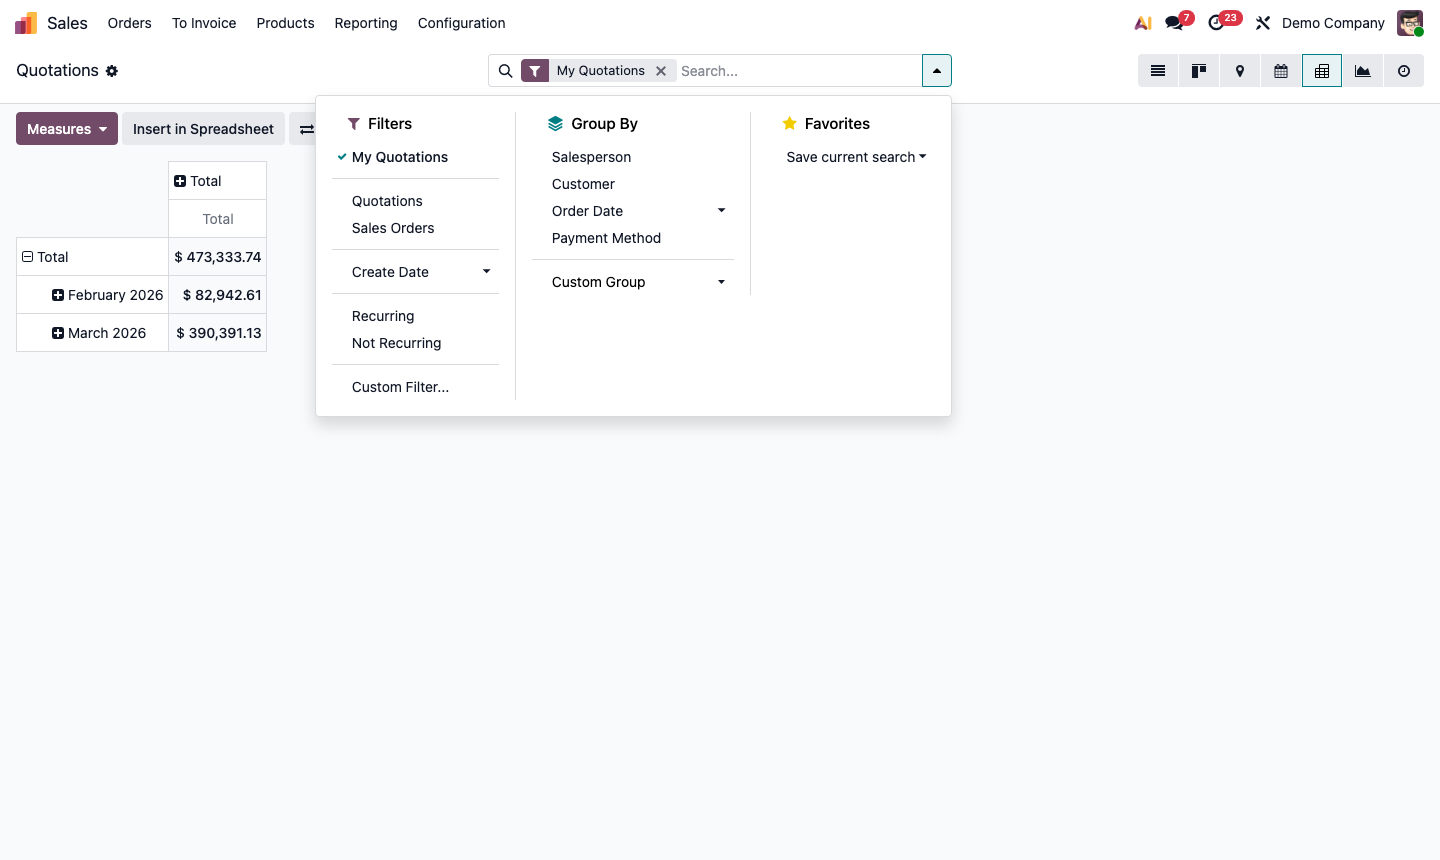
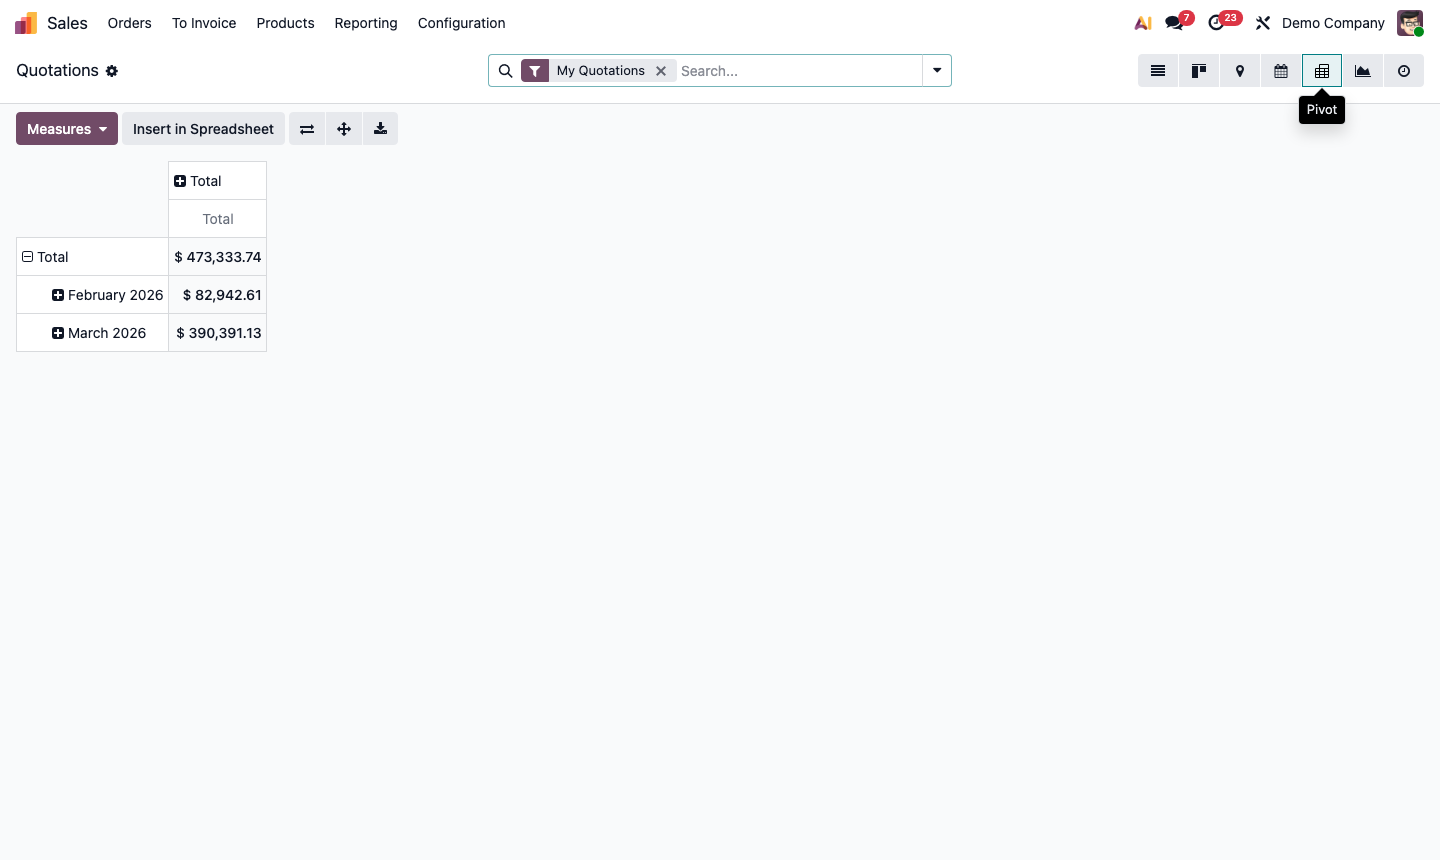
This report aggregates data from all confirmed sales orders. The default view shows orders in a pivot table broken down by:

  • Rows: Salesperson
  • Columns: Order Month
  • Measure: Untaxed Total

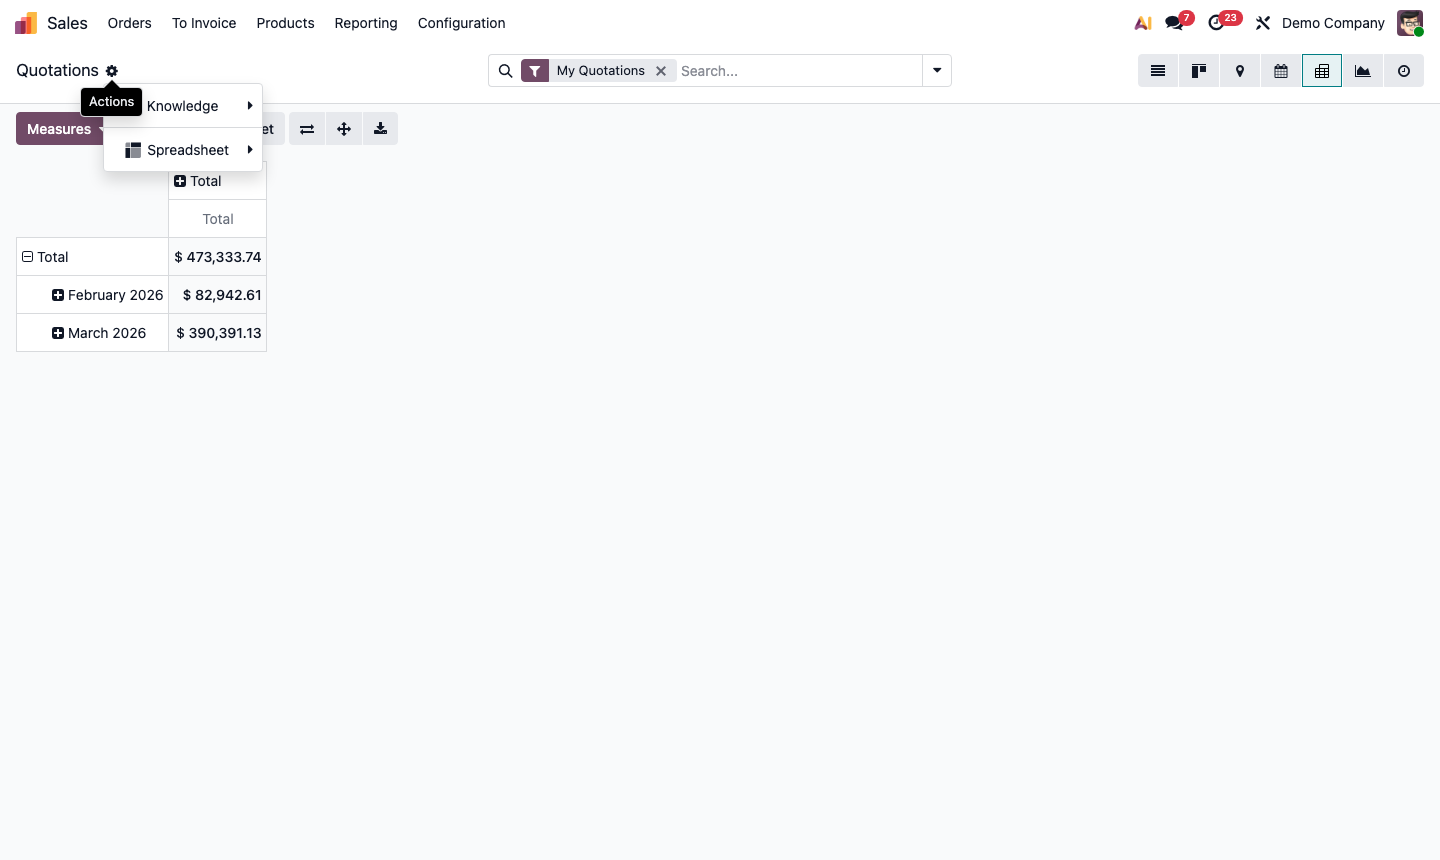
Use the Measures dropdown (top right) to switch the metric:

  • Untaxed Total / Total Amount
  • Quantity Ordered / Delivered
  • Margin (requires margin feature enabled)
  • Number of Orders

Step 1: Sales Analysis pivot table with rows by salesperson and columns by month

2

Slice by Product, Customer, or Category

The power of Sales Analysis comes from combining dimensions. In pivot view:

Add row groups by clicking + Row: add Product, Product Category, Customer, Country, Sales Team, etc.

Drill down: Click any cell total to see the underlying orders.

Useful analyses:

  • Revenue by Product Category this quarter — which categories drive the most revenue?
  • Revenue by Customer sorted descending — who are your top 10 accounts?
  • Orders by Country — where is your geography spread?
  • Margin by Product — which products are most profitable?

Switch to Bar Chart or Line Chart view to visualise trends over time.

Step 2: Sales analysis showing product category breakdown with revenue comparison across periods

3

Compare Periods

To compare this month to last month (or this year to last year):

  1. Click the 🔍 Filters dropdown.
  2. Select This Month (or your period).
  3. Click ComparisonPrevious Period.

Odoo shows two columns per group: current period and previous period, with percentage change.

This is the fastest way to answer “Is revenue up or down from last month?” with context by product and salesperson.

Step 3: Sales analysis with period comparison showing current and previous period columns with change

4

Analyse Order Status and Pipeline

Not all orders in the report are invoiced — some may be in different stages. Use the Status filter to distinguish:

  • Sales Order — confirmed, not yet fully invoiced
  • Locked — invoiced and closed
  • Cancelled — cancelled orders

Combine with the Invoice Status filter:

  • Nothing to Invoice — order confirmed but invoicing not triggered yet
  • To Invoice — delivered but not yet invoiced (revenue waiting)
  • Fully Invoiced — complete

Filtering to “To Invoice” gives you a list of completed deliveries you haven’t billed yet — a critical revenue leak check.

Step 4: Sales analysis filtered by invoice status showing To Invoice orders with amounts

5

Track Sales Team and Rep Performance

Go to Sales → Reporting → Sales Analysis. Group by Sales Team, then add Salesperson as a sub-group.

This shows:

  • Team total vs. individual contributions
  • Which reps are above/below team average
  • Month-over-month trends per rep

Add the Margin measure (if enabled) alongside Untaxed Total to see not just who sells the most, but who sells the most profitably.

For target tracking: Odoo doesn’t have built-in sales targets in the Sales module, but you can add them in CRM (see CRM → Reporting → Forecast) or via the Dashboards module.

Step 5: Sales analysis grouped by team and salesperson showing revenue and margin breakdown

6

Export and Schedule Reports

Export to Excel/CSV: In pivot view, click the Export button (arrow icon). Odoo exports the exact pivot table — rows, columns, measures — to an Excel file.

Insert in Spreadsheet: Click Insert in Spreadsheet to create a live Odoo spreadsheet (similar to Google Sheets) that stays connected to your data and auto-refreshes.

Schedule email reports: From any report view, click Action → Favourite → Save then use Reporting → Schedule Reports (where available) to email a report to stakeholders on a weekly or monthly basis.

Step 6: Sales analysis export dialog and Insert in Spreadsheet option for live reporting